Charleston Area Earthquake Hazards Mapping Project (CAEHMP) Workshop and Pilot Study: Collaborative Research with the College of Charleston and the University of Memphis
Abstract
In 2014 we established a Charleston, SC Area Earthquake Hazard Mapping Project (CAEHMP) via an initial workshop and pilot study. The goal of the workshop was to bring together the interested technical and user communities into a technical working group (TWG) to review past and current earthquake hazard research and define the scope, products, and outreach efforts of CAEHMP. CAEHMP is patterned after similar successful urban seismic hazard mapping projects in St. Louis, MO-IL, Evansville, IN, and Memphis, TN. An establishing TWG workshop was held on March 5-6, 2014 at the College of Charleston to define project scope and efforts. The workshop resulted in project scope and planning documents for the CAEHMP.
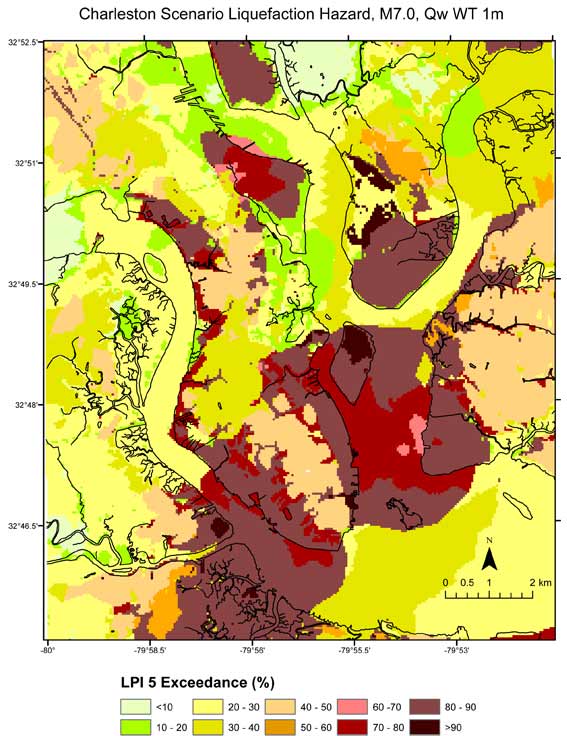
A pilot study for developing urban hazard maps for the Charleston, SC area was conducted in 2014. Urban seismic and liquefaction hazard maps include the effects of local geology. In our pilot study we have used published and available geological, geotechnical, and geophysical information to develop an initial 3D community model for the Charleston quadrangle. The pilot study model includes four alternative Quaternary soil profiles and a deep reference profile for the Tertiary (Cooper Marl) to the Mesozoic bedrock. The South Carolina dynamic soil properties of Zhang et al. (2005,2008) were used in the soil response analysis. Equivalent linear and nonlinear soil response computer programs were evaluated for use in the Charleston urban-hazard mapping project. Site amplification distributions as a function of hard-rock input ground motion indicate significant deamplification at strong ground motion levels both at short and long periods due to nonlinear soil behavior in soft soils. Probabilistic seismic hazard maps were generated using the approach of Cramer (2003, 2011). Initial 2% in 50 year probabilistic seismic hazard maps indicate hazard levels of 0.25-0.35g for peak acceleration, 0.30-0.55g for 0.2 s spectral acceleration (Sa), and 0.3-0.50g for 1.0 s Sa. Seismic hazard seems correlated with Quaternary soil thickness over the Tertiary Marl. At short periods increasing thickness correlates with decreasing hazard due to nonlinear soil behavior. At long periods increasing thickness correlates with increasing hazard due to soil resonance. The liquefaction probability curves of Heidari (2011) are used to generate liquefaction hazard maps using the probabilistic approach of Cramer et al. (2008).
Download the full report here.
Maps and GIS data are available for these probabilistic and scenario maps:
|
|
|
|
|
|
|
|
 2% in 50 years, Qw WT 1m
 2% in 50 years, Qw WT 2m
 5% in 50 years, Qw WT 1m
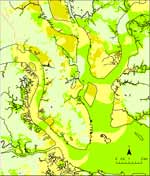 5% in 50 years, Qw WT 2m
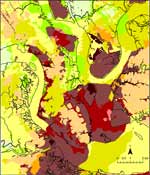 M7.0, Qw WT 1m
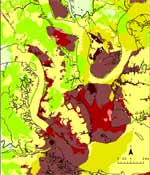 M7.0, Qw WT 2m
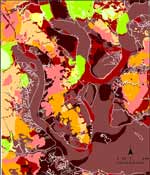 M7.3, Qw WT 1m
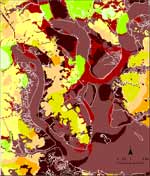 M7.3, Qw WT 2m